Dashboard Overview
The billing dashboard provides detailed insights into your organization’s resource usage, split into two main views: Storage and Usage.Storage
The Storage view allows you to monitor storage usage across different teams. This helps in tracking resource allocation and identifying high-usage teams.| Column | Description |
|---|---|
| Team Name | The name of the team using the resources. |
| # of GIDR’s | The number of GIDRs allocated to or created by the team. |
| Total Storage | The amount of storage space currently consumed by the team (e.g., 10 Mb). |
Usage
The Usage view provides analytics on sessions, interactions, and token consumption. It contains three tables sectioned from top to bottom:Definitions
Session A session is a continuous Gidget conversation or execution context. In the UI, a session starts when a launched Gidget receives the user’s first input. In the API, a session is defined by the client providedsession_id, and all requests using the same session_id belong to the same session.
Interaction
An interaction is one user level Gidget invocation that produces a response. For Chat Gidgets, each user question counts as one interaction. For Flow Gidgets, each full flow execution counts as one interaction. Internal LLM calls, classifier steps, multimodal processing, and ReAct reasoning steps do not count as separate interactions.
Clarification
- Interaction counting is based on the user visible invocation, not the number of internal model calls.
- A single chat question remains one interaction even if it triggers multiple internal LLM, classifier, rewrite, or image related steps.
- A single flow run remains one interaction even if it contains multiple Query LLM or multimodal nodes.
- Token usage is tracked separately from interaction count.
- For API usage, session tracking is controlled by the client through
session_id. - Voice Flow Gidget behavior and some lower level usage details still need final confirmation.
- Expanded service usage telemetry for tracking internal LLM activity in more detail will be considered for a future release.
Sessions
The Sessions table displays the number of sessions per team, including a total at the end and pagination support.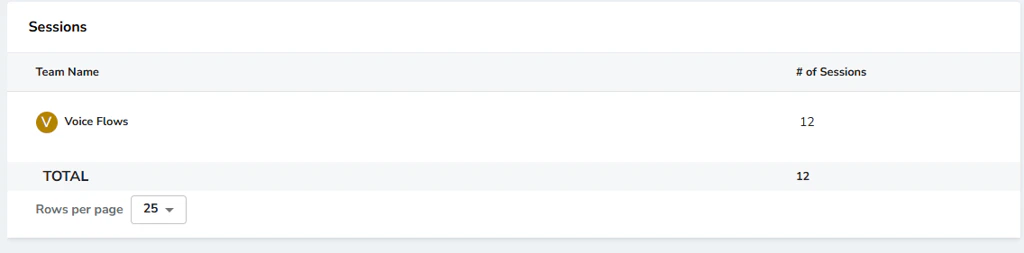
| Column | Description |
|---|---|
| Team Name | The name of the team. |
| # of Sessions | The number of sessions for the team. |
Interactions
The Interactions table displays the number of interactions per team, including a total at the end and pagination support.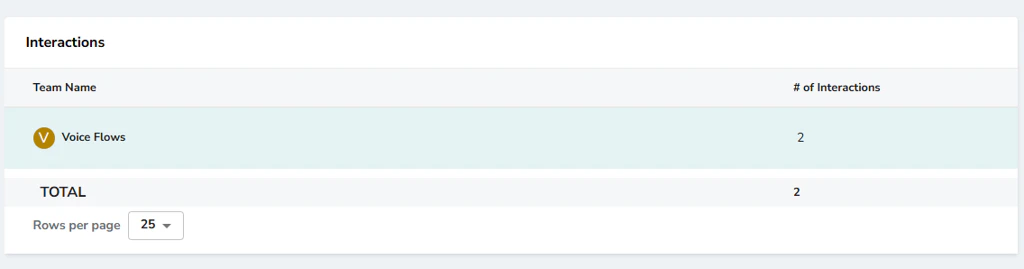
| Column | Description |
|---|---|
| Team Name | The name of the team. |
| # of Interactions | The number of interactions for the team. |
Tokens
The Tokens table view provides analytics on token consumption. You can filter token usage data by specific time ranges:- Today: View token usage for the current day.
- 7 Days: View usage over the past week.
- 14 Days: View usage over the past two weeks.
- Last 30 Days: View usage for the last month.
- Custom Date: Select a specific date range to analyze usage.